
Tables: Canada.ca design
- Last updated: 2025-07-25
Data tables allow you to communicate data efficiently using rows and columns.
On this page
When to use
- Use to present data visually
- Use to organize related information, such as contact numbers and details
- Use tables to organize data (Canada.ca Content Style Guide)
What to avoid
- Do not use data tables to force layout for text
- Never include a data table as an image
- Limit the use of texture and colour (Canada.ca Content Style Guide)
- Avoid having blank cells (Canada.ca Content Style Guide)
How to implement
You can use either the beta or the stable version of this pattern. The beta tables use provisional CSS to make the tables responsive on small screens.
The beta version will eventually replace the stable version.
Beta (responsive) data tables
Beta responsive tables are:
- supported only for simple WET tables that don't have merged rows or columns
- not supported by IE 11
Responsive tables create cards in mobile and small tablet view.
Because this is still in beta, make sure to test your tables in different views, especially if you add a lot of customization.
Screen size:
| City | Population in 2007 | Population in 2017 | Percentage change |
|---|---|---|---|
| Toronto | 5,418,207 | 6,346,088 | 17.1% |
| Montréal | 3,714,846 | 4,138,254 | 11.4% |
| Vancouver | 2,218,134 | 2,571,262 | 15.9% |
| Ottawa–Gatineau | 1,188,073 | 1,377,016 | 15.9% |
Customizing tables
| Option | Description | How to use |
|---|---|---|
| Table borders | Adds a border to help visually separate the table cells when they have a lot of content | Add the class
table-bordered to the
<table>
|
| Condensed spacing | Narrows the height of the cells within the table | Add the class
table-condensedto the
<table>
|
| Striped rows | Alternates the colour of the table rows from white to grey | Add the class
table-stripedto the
<table>
|
| Hover rows | Causes the background to darken when a mouse hovers over a row | Add the class
table-hoverto the
<table>
|
| Left aligned | Align the text in any cell on mobile cards | Add the class
text-leftto the HTML item in the
<td>you wish to align left, like a
<span>or a
<ul>
|
| Simple filter | Provides simple filtering for the table | Add the class
wb-filterto the
<table>
|
| Enable DataTables plugin | Provides searching, sorting, filtering, pagination, etc. DataTables plugin documentation | Add the class
wb-tablesto the
<table> and add the appropriate
data-wb-tables="" values
|
Additional resources
For more information on how to use the beta responsive tables, see the GCWeb: GC tables documentation. The complete source code can be found on Github: gc-table-en.html.
Stable data tables
- Use defined presentation classes for tables included in WET
- Ensure each column treats only one data facet
- Where possible, use WET 4 tables to enable sorting and filtering controls
- this is recommended when there are more than 12 rows
- Add optional pagination controls for any table with more than 12 rows
- Never include tabular data as an image
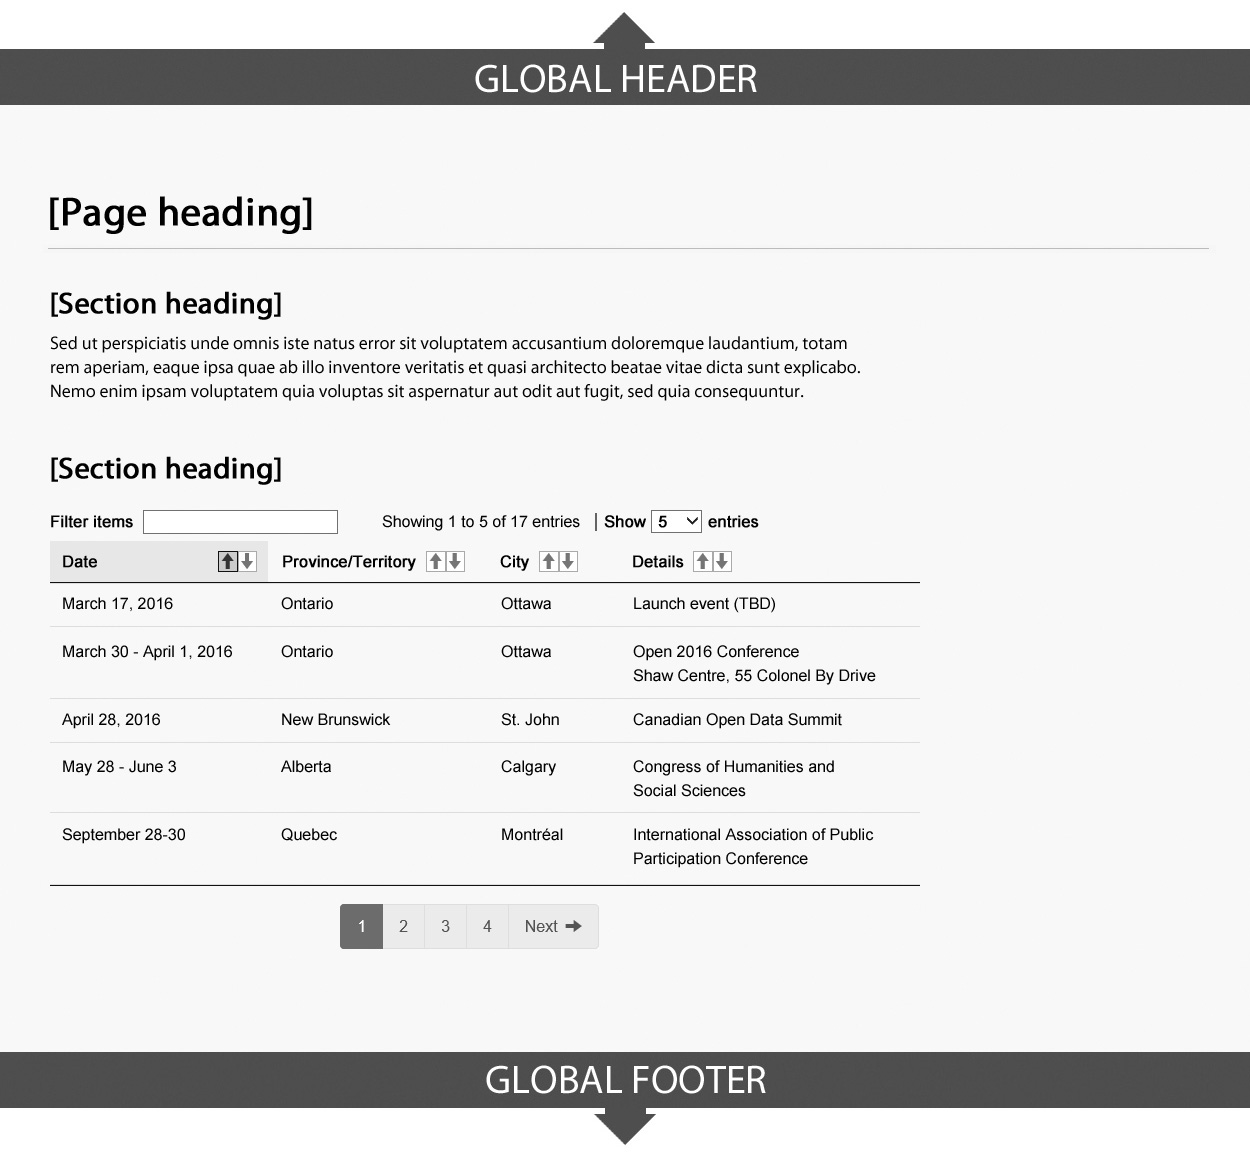
Working example
Example
Research and blog posts
We tested the use of responsive tables successfully during optimization projects with Health Canada for recalls and safety, with CRAfor organizing contact information, and across various COVID-19 content. Responsive tables are easier for users on small screens to use without having to scroll sideways to see all the content.
Latest changes
- Updated the responsive viewer for the beta table
- Updated to include the provisional code for responsive cards
Page details
- Date modified: