
Charts and graphs design pattern: Canada.ca design
Charts and graphs are visualization techniques for communicating data or statistics.
When to use this pattern
- Use charts and graphs to communicate data more efficiently than in text or tables, when there are multiple data points to be presented
- Do not use charts and graphs when the data set is simple enough to be presented as a table, such as when there are few data points
How to use this pattern
- Where possible, use WET 4 charts and graphs, rather than flat images
-
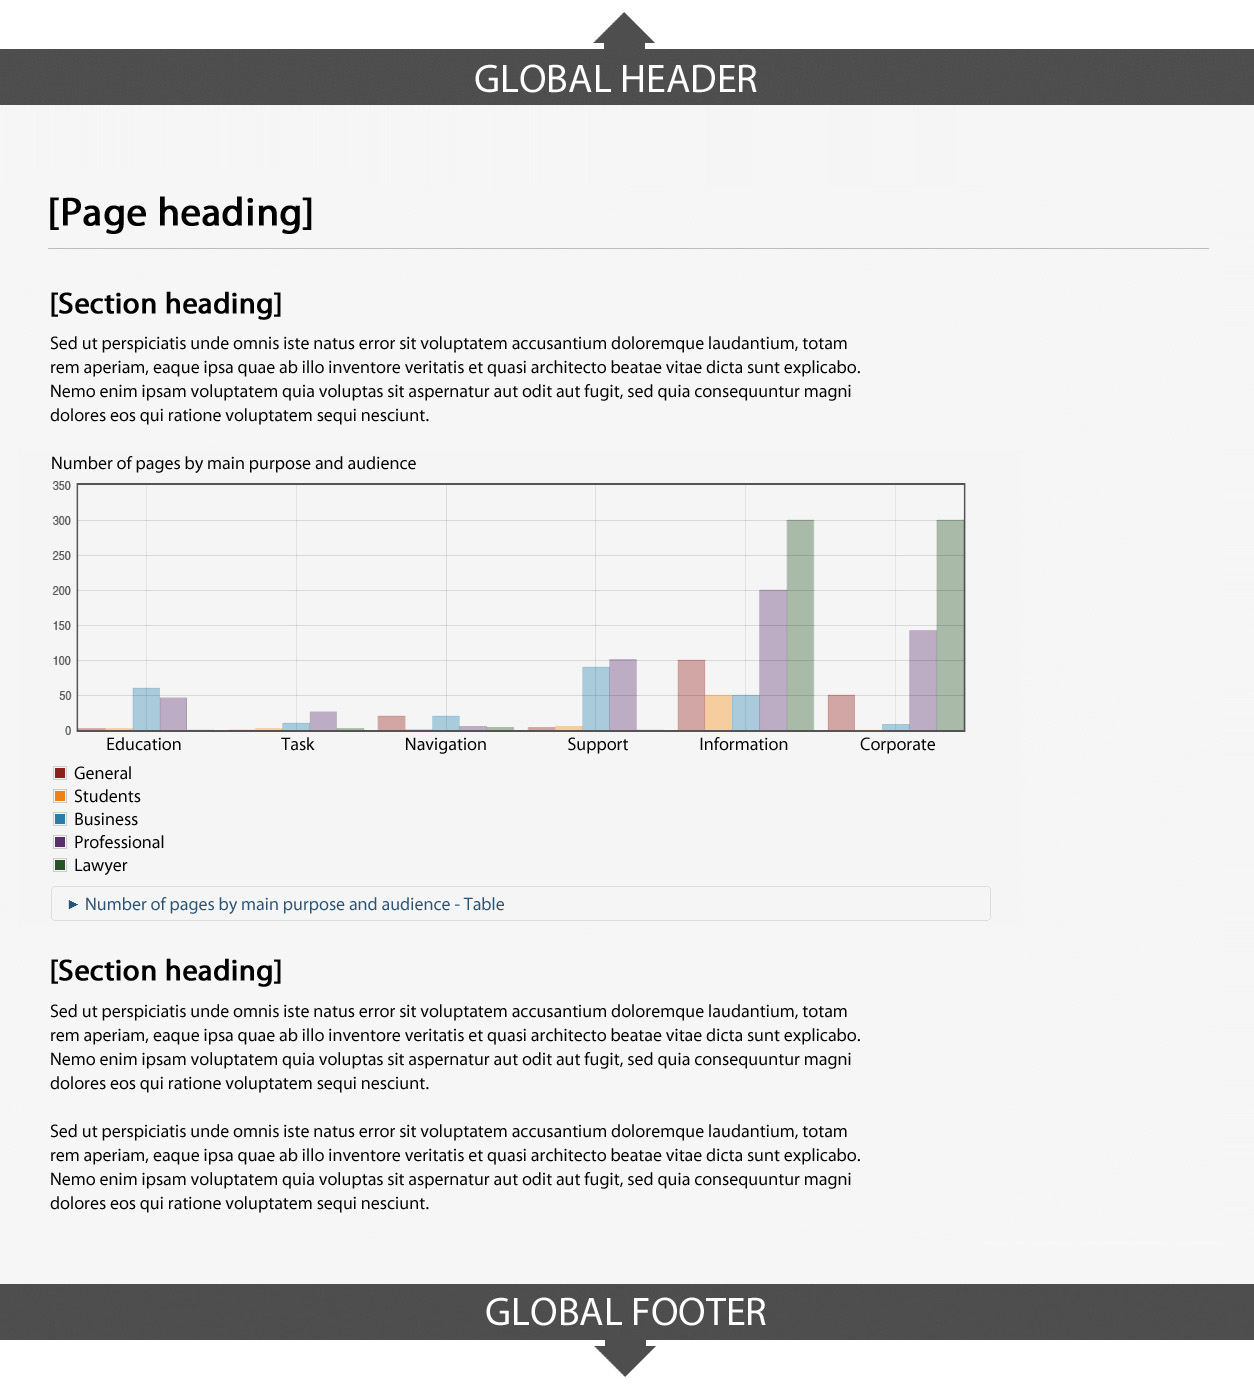
Always include data points as tabular data accompanying charts or graphs
- it is recommended to provide an expandable table with tabular data immediately underneath the figure
-
Size and place charts and graphs appropriately for the context they are in
- they must appear connected to the related content
- Do not place charts and graphs in line with text blocks such as in a paragraph; rather, place them in between text blocks
- Maximize available space to enhance readability
- Keep charts and graphs as simple as possible
Working example
Example
Page details
- Date modified: